SQL Server - StatMan
Due to the nature of being consultants we here at Rich Benner Consulting often perform maintenance on behalf of customers outside of normal business hours. This is done for many reasons but the usual reason is that we do not want to potentially impact the daytime workload for companies that are not 24/7 fully operational (think factories, accounting software, things that are only used when a human is interacting with them.
One thing that has to be considered when planning out of hours maintenance is overnight processes (think index maintenance, backups, overnight ETL loads) that can have a big impact on resource usage and are intentionally run outside of working hours themselves.
The Query Store is a great feature that we use extensively. It has a query regression graph which shows you queries that are performing more poorly recently than they used to be. This helps enormously when changing things like compatibility levels and making changes to things like MAXDOP and the legacy cardinailty estimator.
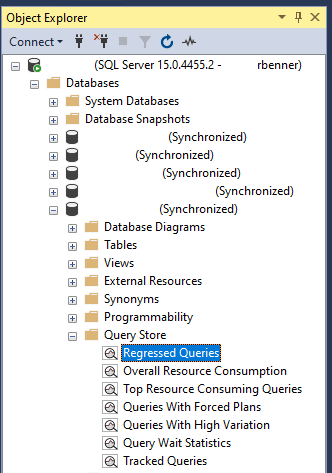
This is where you’ll find the graph in SSMS.
In the top right of the reports you’ll see a Configure button, when clicked you’ll see these options.
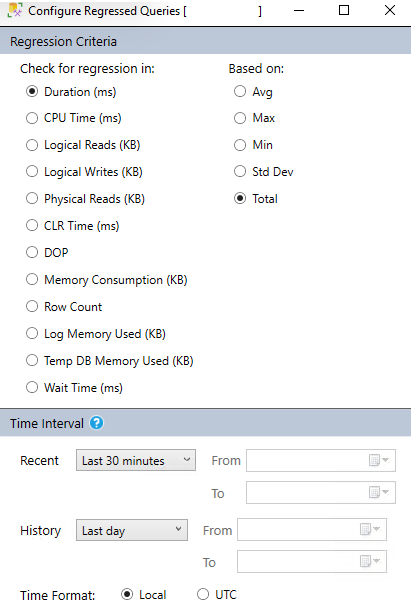
Using the settings above, we’re looking for queries that are slower over the last 30 minutes than they have been in the last 24 hours.
This is what the results look like on this server;
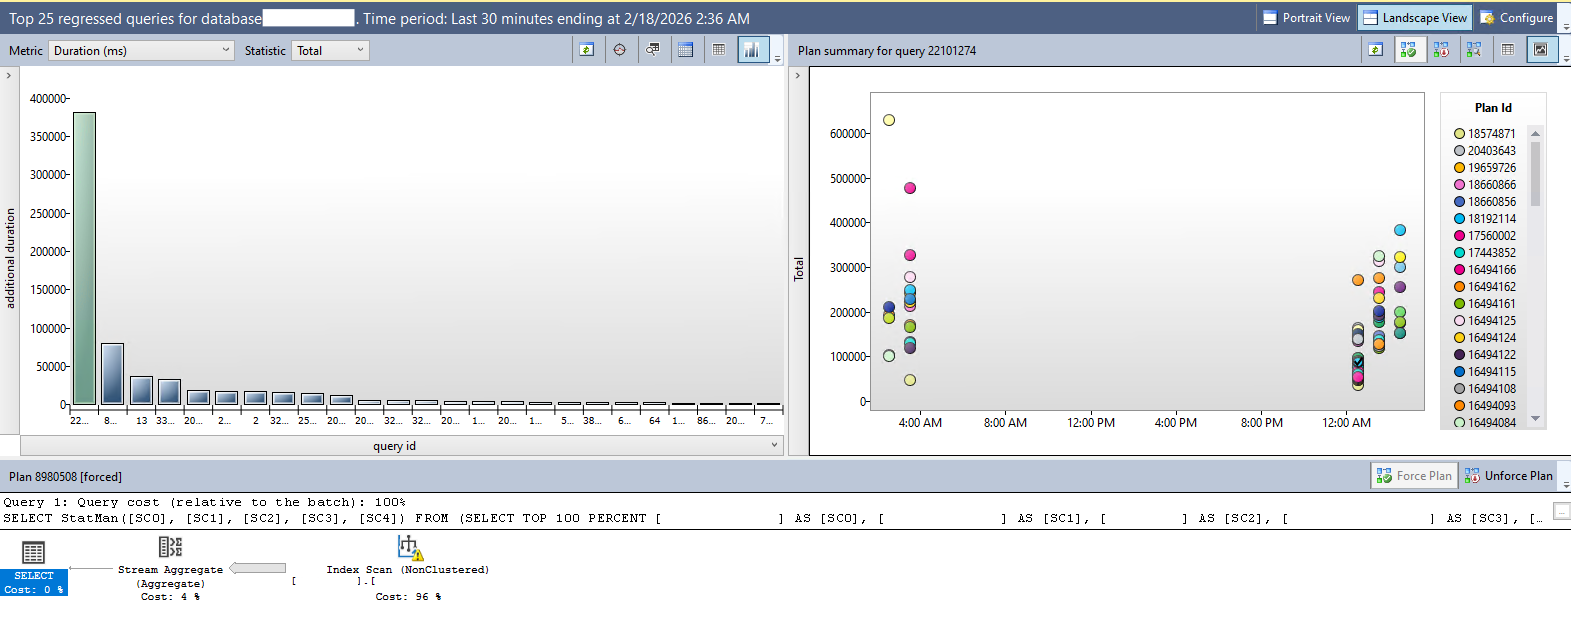
The graph on the left shows you which queries have regressed and compare them to each other so you can easily find your problem. The columns are clickable and will show you the data for each underlying query. The graph on the right shows you the total duration (in this instance) for each plan id that has been used. You can hover over the dots for more information (total executions, total duration, average duration, max duration, min duration etc).
The thing that can catch you out here is the StatMan function that you can see being used in the T-SQL statement at the bottom of the picture. This query is showing as the most regressed at the moment.
You won’t find any Microsoft documentation about this function as it’s an internal and undocumented stored procedure. It’s what actually happens when you invoke (or the system automatically invokes) statistics updates. It’s doing some aggregation of the values that fall within specified range to give the query optimizer the best chance of knowing how your data is laid out and coming up with appropriate execution plans.
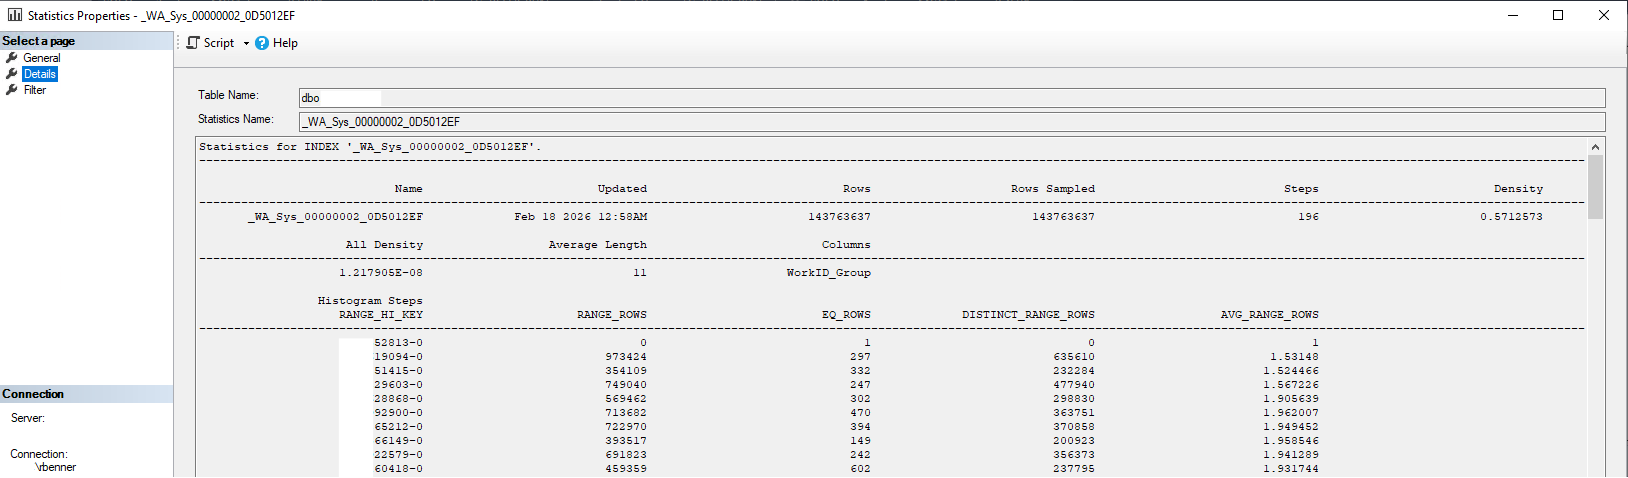
This is what the histogram data looks like if you view it within SSMS. Take note of the range keys and how many rows are within each of those sections.
So if you’re confused what this StatMan function is, there you go. If this is causing you issues then you have a few things to investigate.
These stats updates can be kicked off on a regular schedule (I love the Ola Hallengren maintenance solution scheduled via an Agent Job). If these are causing you issues, are you being a little aggressive with your thresholds? Are you using the @OnlyUpdatedStatistics parameter so you don’t have to update all of your stats every time? Are you using @StatisticsSample = 100 or similar? That’ll cause a full scan of the table (the default is to sample 5% of data in a table).
The alternative is that they can be called automatically when the system decides that your stats are out of date, this can be at any point and may not happen at the most opportune time, maybe you want to schedule these outside of working hours to get ahead of the curve?
Ultimately this is a decision you’ll have to investigate and choose what works best for your environment, but hopefully this has helped.
Good Luck!